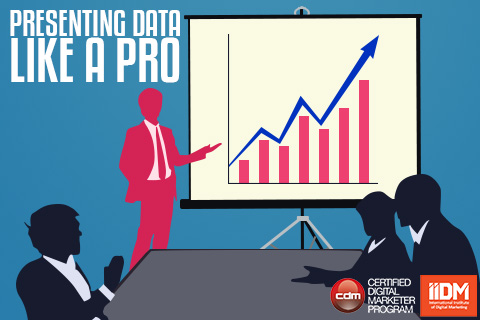
Presenting data like a pro
In this age of tablets and nifty office apps, PowerPoint presentations are still a staple in every entrepreneur’s marketing arsenal. If your presentation is heavy with statistics or data, you may want to convert these into smaller pieces of information by using graphs and tables.
PowerPoint can deliver an excellent image of graphs and charts but for better data visualization, look into software applications like Tableau. Why get into data visualization?
Noah Iliinsky, co-author of Designing Data Visualization writes in his blog visual.ly that our visual system is extremely well built for visual analysis. In fact, he says one study estimates the transmission speed of the optic nerve at around 9Mb/sec.
The Certified Digital Marketer (CDM) Program shares in the Digital Marketing Analytics Specialist Track five basic data visualization tools to use when presenting data; time graph, bar chart, histogram, scatter plot and pie chart.
Each tool represents a specific correlation between two or more variables. For instance, pie chart is a good way to express percentage share for several categories while line charts are illustrate trends over time. Whichever tool you use, keep in mind the three superior graphic representations identified by John Sviokla of Harvard Business Review:
- Great visualizations are efficient – they get people to look and comprehend the vast quantities of data presented.
- Data visualization can help analysts derive more precise campaign insights or act upon ineffective marketing strategies.
- Excellent data visualization can help your team understand the current situation and what needs to be done for optimization.
Learning to present data can help each professional, whether a marketer, an advertisers, entrepreneur, or business strategist to monitor and measure real-time success of each campaign.
Be equipped with the right skill set needed to create a data visualization masterpiece. Learn more about data analytics tools and practices in the Digital Marketing Analytics Specialist Track of the Certified Digital Marketer (CDM) Program.
Request for the course curriculum at imadigitalmarketer.com or call 927-0096, 0928-506-5382.
